Adding, Changing, & Filtering
mutate()
The mutate() function let’s us add or change columns. We can add a new column simply by giving it a name and a definition.
Let’s say that we wanted to find out the ratio between penguin bill length and depth We can create a new column called bill_ratio and do some column math for its value:
Remember, because the columns are all numbers, you can perform mathematical operations just using their name.
You should now see that instead of a tibble that is 344 x 8 observations, we have 344 x 9, with the new column bill_ratio appearing at the end. If you wanted to keep that bill measurement column at the beginning beside the other bill measurements, you could use select to change the order of the columns.
We can also overwrite a column if there’s something in it we need to change. Let’s say that after this study the researchers found out that their scale for measuring the penguin body mass was actually off by 20g and now we need to subtract that amount from each weight. What we can do is just set the body_mass_g column equal to the new formula for weight:
Practice
Let’s say that instead of recording the year as 2007, 2008, and 2009 we wanted to just have them labeled as 1, 2, and 3. Write code to change year to just the single number.
Currently, the body mass of penguins is in grams. Write code to display just the species, sex, and mass of penguins in kg, in that order.
filter()
Filtering is a way to subset a dataset by rows and keep only the rows that meet a certain condition. To do this, we use the filter() function, which will remove rows that don’t satisfy the condition in the parentheses.
An example would be if we want to find all the penguins over a certain weight. We would put our weight cutoff as the condition to be met. Here we’ll find all penguins that weigh over 6000 grams.
You should see only two Gentoo penguins are that heavy.
Practice
Try writing code to find penguins that are more than 3000g but less than 3500g.
You should see that the output is a tibble with 60 rows.
How would you find all penguins more than or equal to 6000g? (You may need to do some googling or take a guess and see if you get an error.)
Now you should see 4 big boys.
Using filter() to Match Values
You can also use the filter on what are called strings or characters, meaning words. So, you could filter to find only the species that match the string “Gentoo”. To do this we use the == operator. We use a double equals to show that we want to match the value and not that we want to set something equal to that value.
Filtering by species == "Gentoo" will show the values for all 124 Gentoo penguins.
Importantly, notice that Gentoo is in quotes and is capitalized. We want to match with a species based on its name, which is a character, so we need the quotes, and R is always case sensitive.
One thing to take not of is that you can make filters that might seem like they run but they don’t actually pull out any results. If we run the following code it will look like it runs successfully, but the new object is actually empty.
Running this reveals the object is empty because there were no values that perfectly matched “gentoo”, so it created the new object but had nothing to store in it.
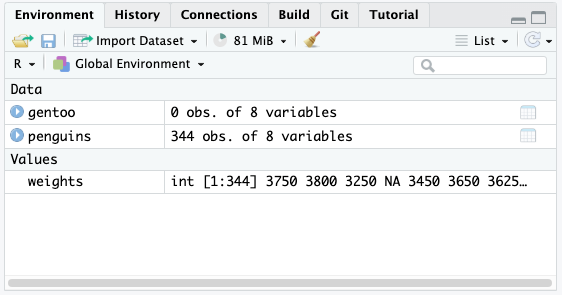
In the Environment pane in RStudio you will see gentoo be created but that it has 0 observations.
 ### Filtering to Remove Values
In R, the character ! can be interpreted as “not”. So using the operators != translates to “does not equal”. We can use that in our filters the same way we use the == but this time we’re doing the opposite.
See if you can write code that filters to remove all of the Chinstrap penguins from the dataset.
For more information on mutating and filtering please see the Cleaning & Wrangling workshops. These are powerful functions that can do a lot more than what we’ve done here.