Graphing Resources
There are a lot of good places to get help with your graphs (including the Data@Reed website), but these are some of my favorites.
STHDA
https://www.sthda.com/english/
I lament that this site has been semi-recently updated to include lots of crappy ads, but it is still my favorite site for learning about how to visualize data with ggplot. The name is actually Statistical Tools for High-throughput Data Analysis, meaning just tools for analyzing big data quickly.
It has all the most common ggplots broken down into step by step instructions of how to customize them. Here’s an example for scatterplots.
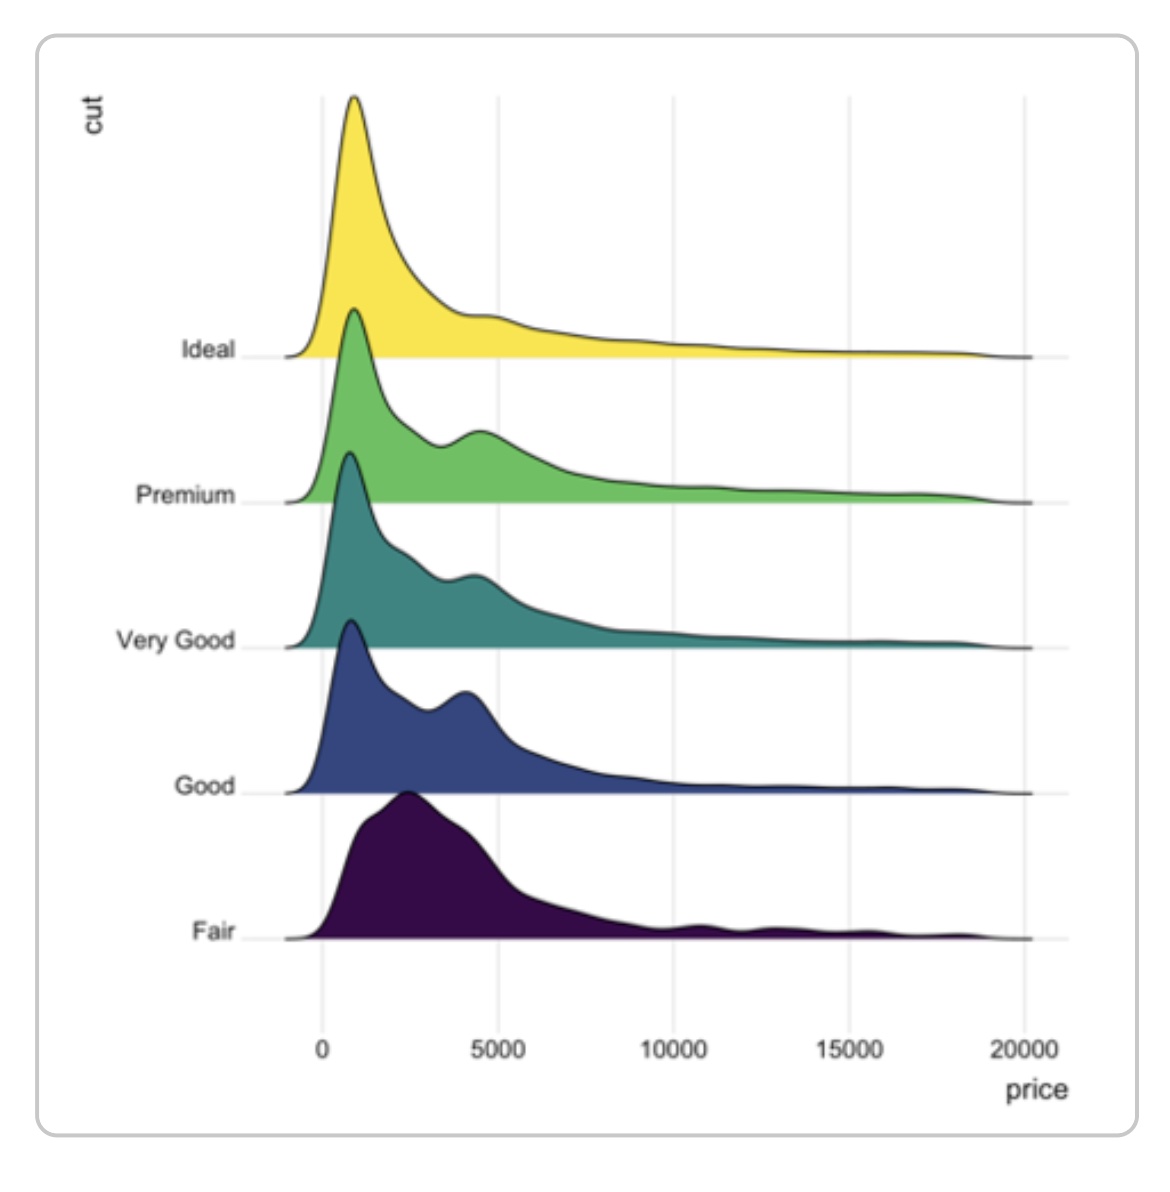
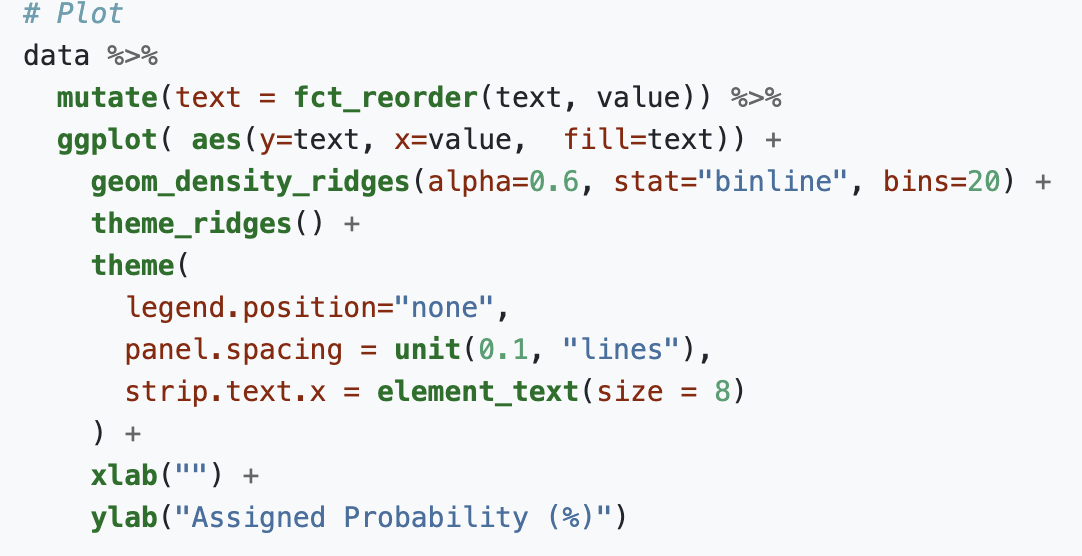
The R Graph Gallery
https://r-graph-gallery.com/
This is a great resource if you want to look through a bunch of pretty graphs and pick which you want to emulate. If you scroll down on the main page, you can see all the different types of plots available to you.
When you click one, you’ll see several examples of that type of plot, for example ridgeline, and when you click on one of those it will show you all the code that was used to make that plot.
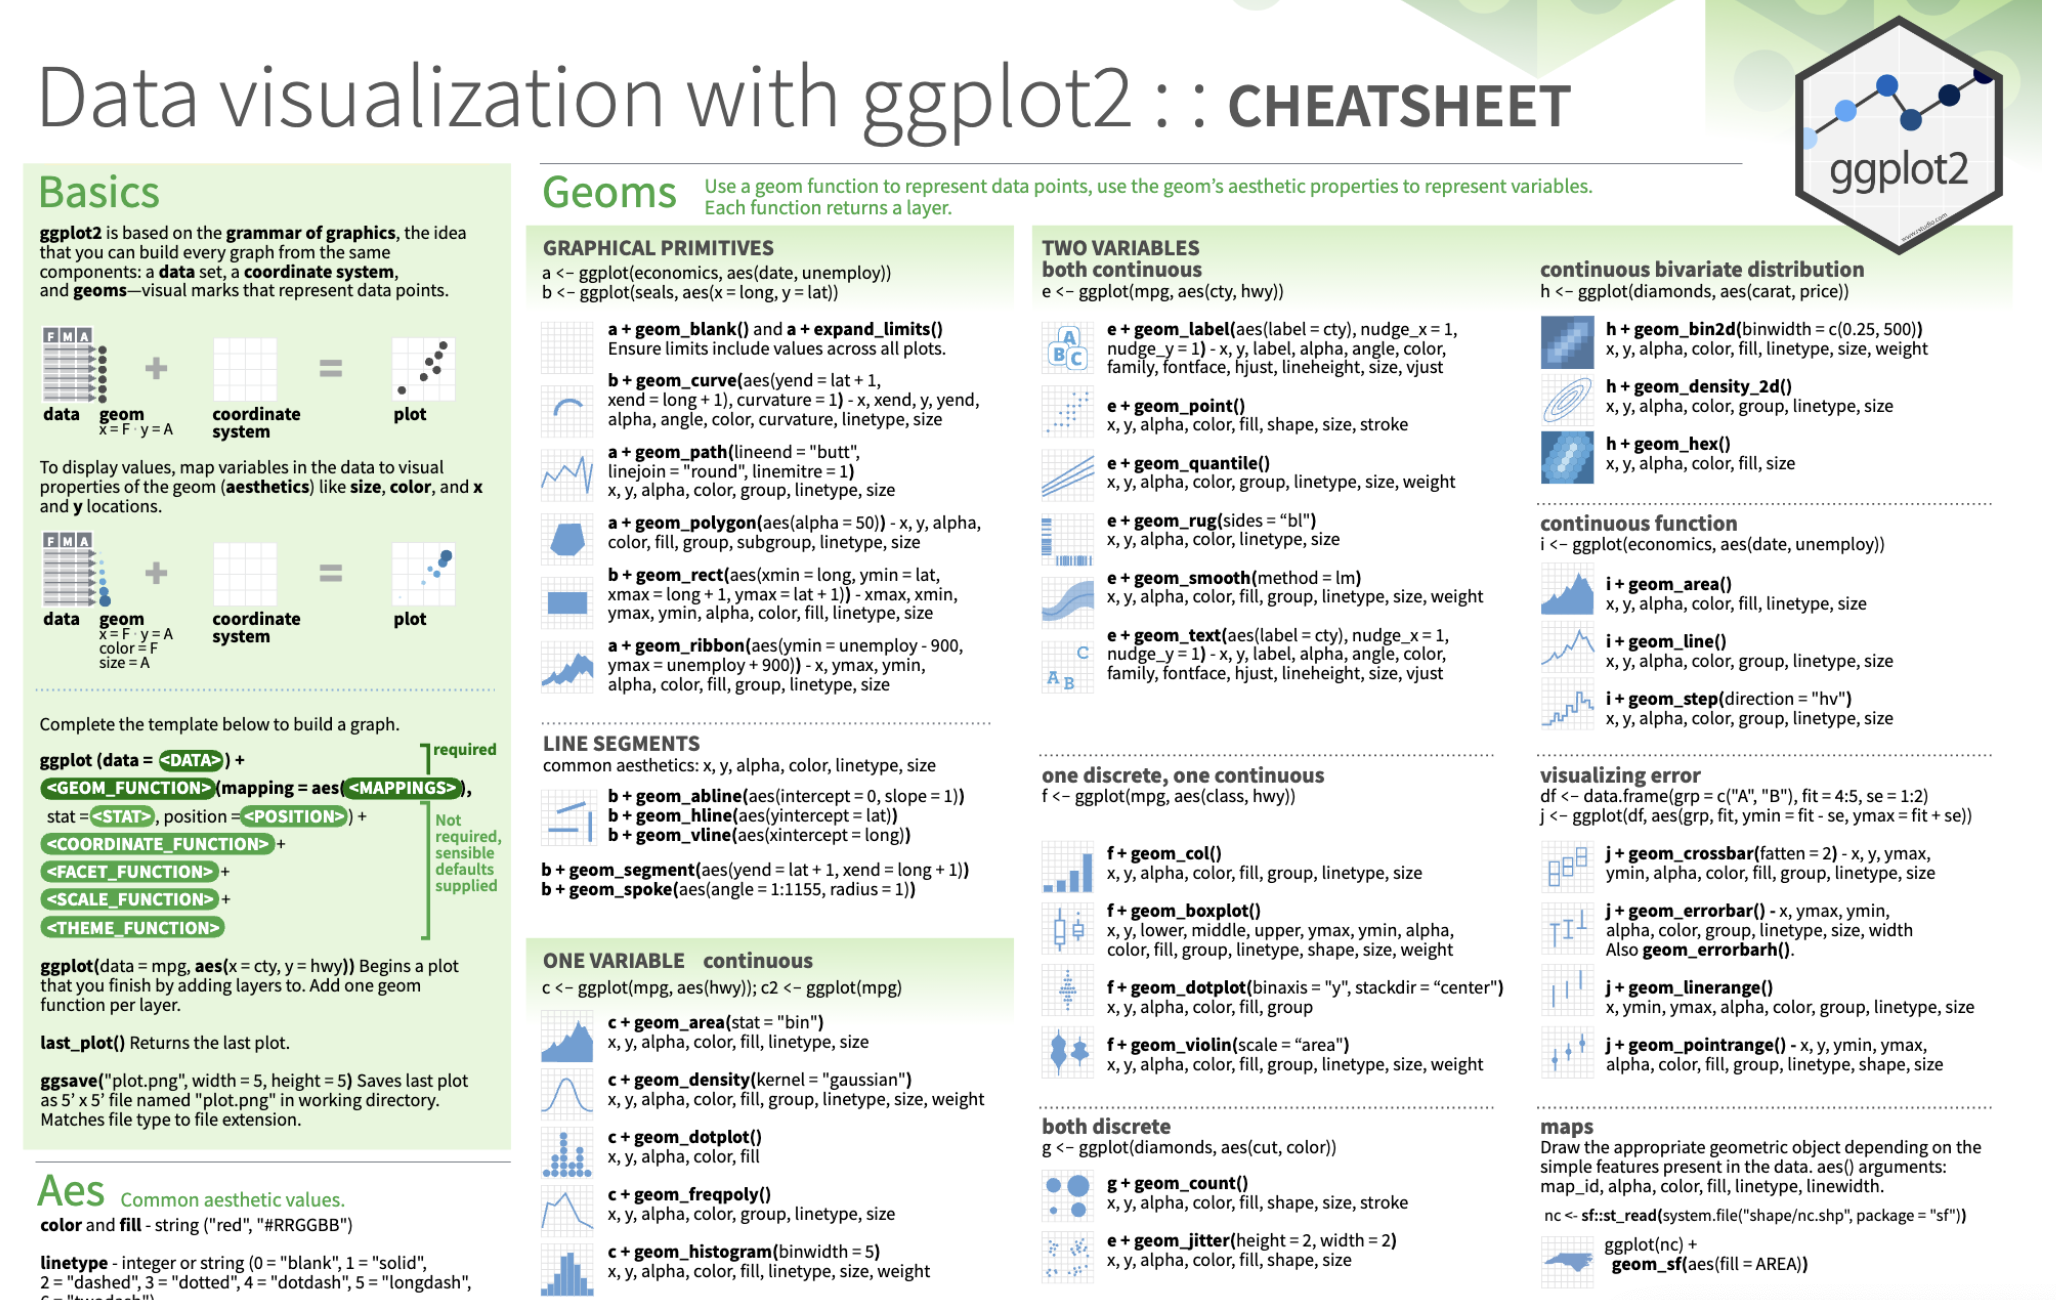
ggplot2 Cheat Sheets
https://ggplot2.tidyverse.org/index.html
These are put out by the people behind RStudio and they have in shorthand all the functions in the package. They are quite dense, but once you get the hang of making plots, they can be very useful.