fruits <- data.frame(x = c("apple", "banana", "orange"),
y = c(2, 6, 3))Printable Tables
This section will show you how to make your tables look a little nicer. The package {gt} will make nice images of the basic R tables. The name “gt” comes from the official name “Grammar of Tables”, but many people (including myself until writing this) think it stands for “great tables”.
Note that the tables are images and if you try to just copy and paste the text and put it in Word, for example, the formatting is not guaranteed to transfer nicely. You’ll need to add the table the same way you would a picture.
Unfortunately, the {webr} package that makes this code interactive does not get along with the {gt} package at the time of writing this. So the code here in not executable in the browser, but will work fine in the server or desktop versions of R.
Nicer Basic Tables
Here’s an example of code for a small table and the resultant output that you would see in R.

The table is pretty ugly and you’d have to do a lot of formatting after copy and pasting it to Word or Google Docs to make it look nice. Or, you can take the table object that you created and run it through the gt() function.
fruits |>
  gt()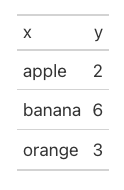
That looks quite a bit nicer already, but we can also add column labels to make it more meaningful.
fruits |>
  gt() |>
  cols_label(x = "Fruit", y = "Count")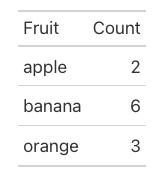
Let’s try the same thing with the penguin data. First we’ll create an ugly summary table for penguin bill length.
summary <- na.omit(penguins) |>
  group_by(species, island) |>
  summarize(n = n(),
            bill_length_mean = mean(bill_length_mm),
            bill_length_sd = sd(bill_length_mm),
            bill_depth_mean = mean(bill_depth_mm),
            bill_depth_sd = sd(bill_depth_mm))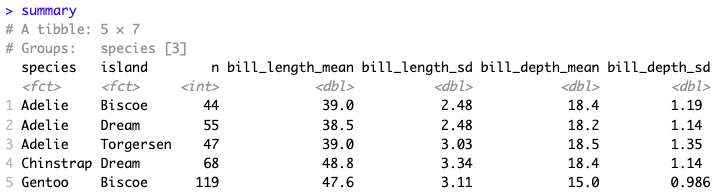
Now we’ll run it through gt() and change the column names. We’ll also add some formatting to the numbers that appear with the function fmt_number(). The default number of decimals is two, but you can change that if you’d like. And if you have numbers that you want to contain commas, that also is an option you can find in the documentation. (Remember: ?function_name will get you the documentation.)
nice_summary <- summary |>
  gt() |>
  cols_label( island = "Island",
              n = "Count",
              bill_length_mean = "Mean Length",
              bill_length_sd = "SD Length",
              bill_depth_mean = "Mean Depth",
              bill_depth_sd = "SD Length" ) |>
  fmt_number(columns = c(bill_length_mean,
                         bill_length_sd,
                         bill_depth_mean,
                         bill_depth_sd))
nice_summary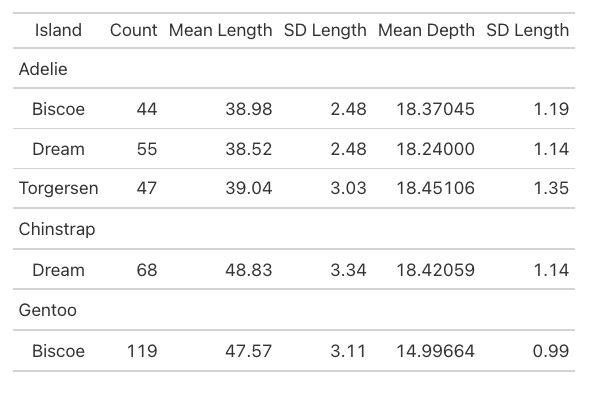
A couple other useful things to do might be to add a title, subtitle, or source note about where the data is from. Here’s an example of how to add each of those.
nice_summary |>
  tab_header(
    title = "Penguin Bill Lengths",
    subtitle = "Grouped by Species and Island"
  ) |>
  tab_source_note(source_note = "Data from {palmerpenguins}")