Changing Axis Titles and Labels
By now you are probably familiar with the basics of adding labels to your graphs, but this section will show you a few common alterations you may want to make. We’ll use the same dataset we’ve used in previous workshops: penguin data from the {palmerpenguins} package.
A basic graph with axis labels will have this format:
Adding or Removing Titles
Let’s start by changing the legend title:
If we do that, we may not want to have the labels on the x axis. Anytime we want to remove something we can set that element to be blank by adding a variation of the line: theme(____ = element_blank())
So for removing the x-axis labels, you would use:
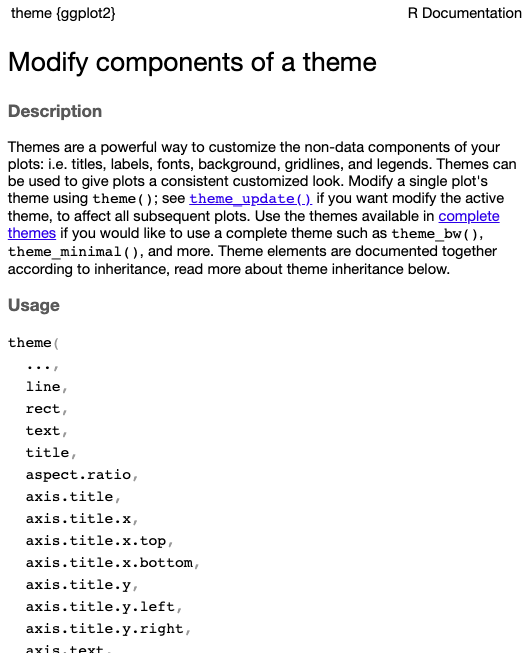
You could do the same thing for the y-axis labels or the axis titles. You can see all the components that are changeable by running the code ?theme. This will then show you all the options for the theme function, which you can see a fraction of below.
Note: Remember you can always run
?functionto see the documentation for any R functions.
One caveat to this is if you are trying to remove the legend entirely, you should set its position to none rather than using element_blank().
Changing the Font
Let’s say for our main title we want it bolded, centered, and in a larger font size. All of these are possible by using the options within the element_text function. (See all of theme by running ?element_text.)
It’s probably obvious how face and size work, but hjust is what controls the centering. It stands for “horizontal justification” and all the way to the left is 0 and all the way to the right is 1, so centered is 0.5. There is also vjust which will move the text up and down; here 0 is the bottom and 1 is the top. But for plot.title (and other titles) vjust won’t do anything unless you change the margins.
Trying changing the y-axis label to be italicized and colored red. (You’ll need to look at the element_text documentation.)
The last thing we’ll do is rotate the x-axis labels. It isn’t really necessary for this graph, but for graphs with long labels it helps to make things legible. We’ll still use a component of element_text for this:
Here we changed the angle to be 90°, but you can angle it anywhere between 0° and 360° (the default being 0). The angle pivots from the center of the text, so you may also need to move the text up or down to make it look right. Try using angle 45° and adjust the height accordingly: