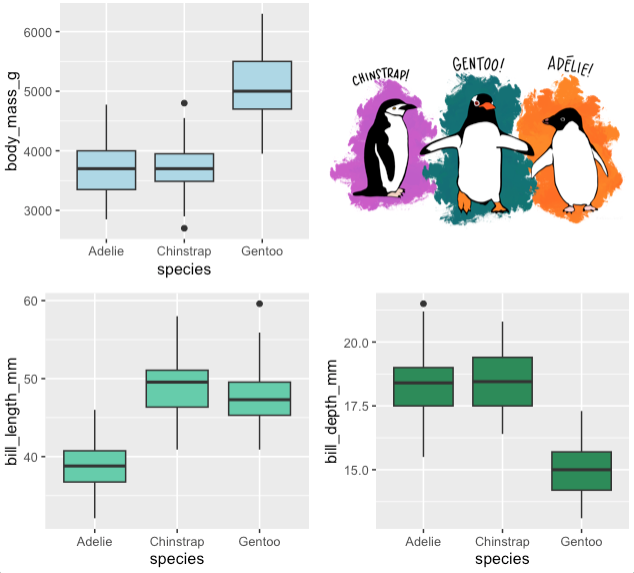
library(png)
img <- readPNG("images/penguin.png")
grob2 <- rasterGrob(img, interpolate = TRUE)

grid.arrange(mass, grob2, bill_length, bill_depth,
ncol = 2)Arranging Figures
The previous examples were basically all taking one graph and splitting it up into multiple units. But what if you want to put two totally separate graphs in one figure? Then, you’ll use the packages {grid} and {gridExtra}. (Should {gridExtra} automatically load {grid}? Yes. Does it? No.)
Combining Plots
Let’s combine the all the penguin data graphs into one figure. The way to do this is to first make each graph and then use the function grid.arrange() to combine them.
When making the graphs be sure to store them as an object so you can later call them by name.
Now we’ll use grid.arrange() to put them all together. I’ll also specify to have two columns and it will know to divide them evenly between the columns.
Pretty simple!
Combining Grobs
The nice thing about the {gridExtra} package is that it allows you to combine together any objects you want, including text or images. The things you are combining are called “grobs” so if you want to combine something that isn’t a graph, make it a grob and then add it to the list. (Graphs are technically already grobs.)
In that code just will place the text in the center of the grob.
We can also add in images. This next bit of code also relies on the package {png}. {webr} cannot access images yet and if you’re running this code on your own version of R you won’t have this image, so this code isn’t executable but it would produce the following figure.