Conclusions & Future
Tada! Now you are an expert in R! But seriously, hopefully you know now what R is capable of and the basics of how it works. You can fill in the specifics as you continue to learn.
What You Have in Your Script
First, if you didn’t take perfect notes during the workshop, here’s a copy of the script we generated.
In this script, you learned how to:
- load libraries
- load data
- manipulate data by adding, deleting, renaming, and changing columns
- use the pipe operator to string commands together
- filter data based on a certain characteristic (match to a value, exclude certain values, keep only things larger than certain values)
- automatically change values in a column based on conditions
- calculate summary statistics for entire columns or for different groups within columns
- pivot a table to make it easier to graph or analyze
- make basics graphs of multiple types
- perform t-tests, ANOVAs, and linear regressions, which can be used to predict future values
Help Sites
Getting help from others (websites, people, AI) is going to be a necessary step as you continue to learn R. Here are some of my favorite places to get help:
The DataLab
The DataLab is an excellent resource that we have on campus. The DataLab is where student workers can help you out with anything data-related: your homework, your thesis, your personal projects, whatever. There’s no limit on how frequently you can use come to the DataLab; just drop in any time the calendar says it’s open If none of the times work for you, please email data@reed.edu to schedule an appointment at a different time.
Online Tutorials Like This One
On the Data@Reed page there is a link to a series of interactive online workshops, similar to this one, to go through steps in more detail.
R for Data Science
This is an online manual written by people that are the main creators of R. It will help get you going on the basics of how coding works as well as analyzing and visualizing your data. r
STHDA
The site Statistical Tools for High-throughput Data Analysis or STHDA is a great resource for helping you make graphs. The name is , meaning just tools for analyzing big data quickly. It has all the most common ggplots broken down into step by step instructions of how to customize them. Here’s an example for scatterplots.
The R Graph Gallery
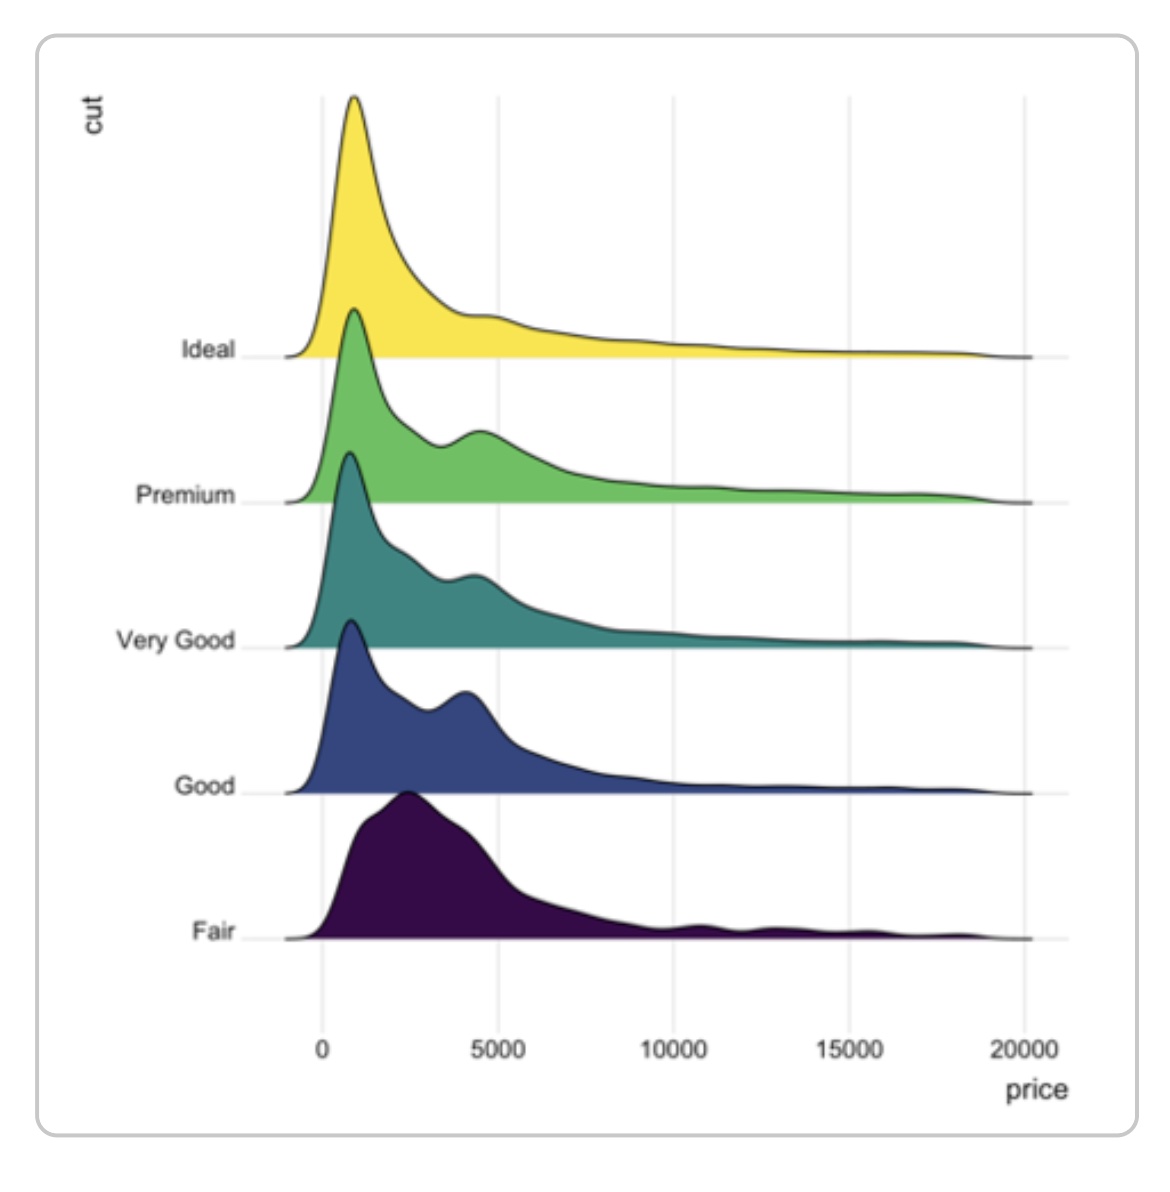
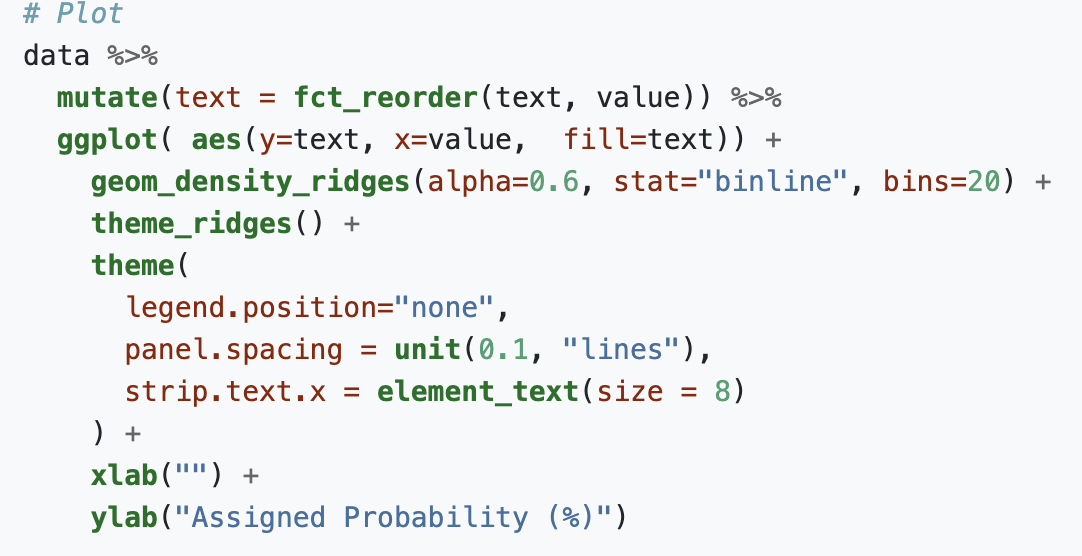
This is a great resource if you want to look through a bunch of pretty graphs and pick which you want to emulate. If you scroll down on the main page, you can see all the different types of plots available to you.
When you click one, you’ll see several examples of that type of plot, for example ridgeline, and when you click on one of those it will show you all the code that was used to make that plot.
StackExchange/StackOverflow

These sites are what come up most commonly when you are searching for how functions work or pasting your errors into Google. They are sites where users post questions and other users answer them. It is likely that someone has had your same question before, so if you see one of these links come up in a search, they’re good places to check.